
brix2bytes IoT platform · en:predict powered by BrainBox AI
A modern building deserves more than data. It deserves clarity.
The brix2bytes IoT platform turns your building's data into concrete insights for operations, energy and asset management. en:predict additionally optimises your systems with artificial intelligence.
See more. Act sooner. Decide better.
- 1Office · Chiller Score 92
- 2Clinic · AHU 01 Score 71
- 3School · Room climate Score 88
- 4Town hall · Room 3.12 +2.4 K
- 5Plant · Heating Score 95
The challenge
The most expensive building data platform is the one nobody uses.
Without a shared data foundation, potential in day-to-day operations stays invisible and decisions take more effort than they should. Three typical situations and what brix2bytes makes of them.
Data stays scattered
Different formats and systems prevent a reliable overall picture.
One prepared source for the entire building, in which all trades become comparable.
Deviations go unnoticed for too long
There are no rules for checking the quality of the technical systems, and with them no way back to quality.
Scores and KPIs show at once where action is needed and when Kieback&Peter service is required.
Major energy consumers are hard to find
Generation, distribution and consumption can only be traced with extra effort.
Energy flow, Sankey and regression make relationships clear at a glance.
Drag the slider: from data silo to a shared data foundation. Sample values.
One platform, four perspectives
From valve to boardroom. Everything in view.
From detailed analysis of individual systems to the portfolio dashboard, in one consistent data world.
Monitoring
Search less. Act more precisely.
See faster where control, systems, room climate or setpoints need attention.
- System performance across all trades at a glance
- Statistics on setpoint deviations
- Rating per subsystem with drill-down
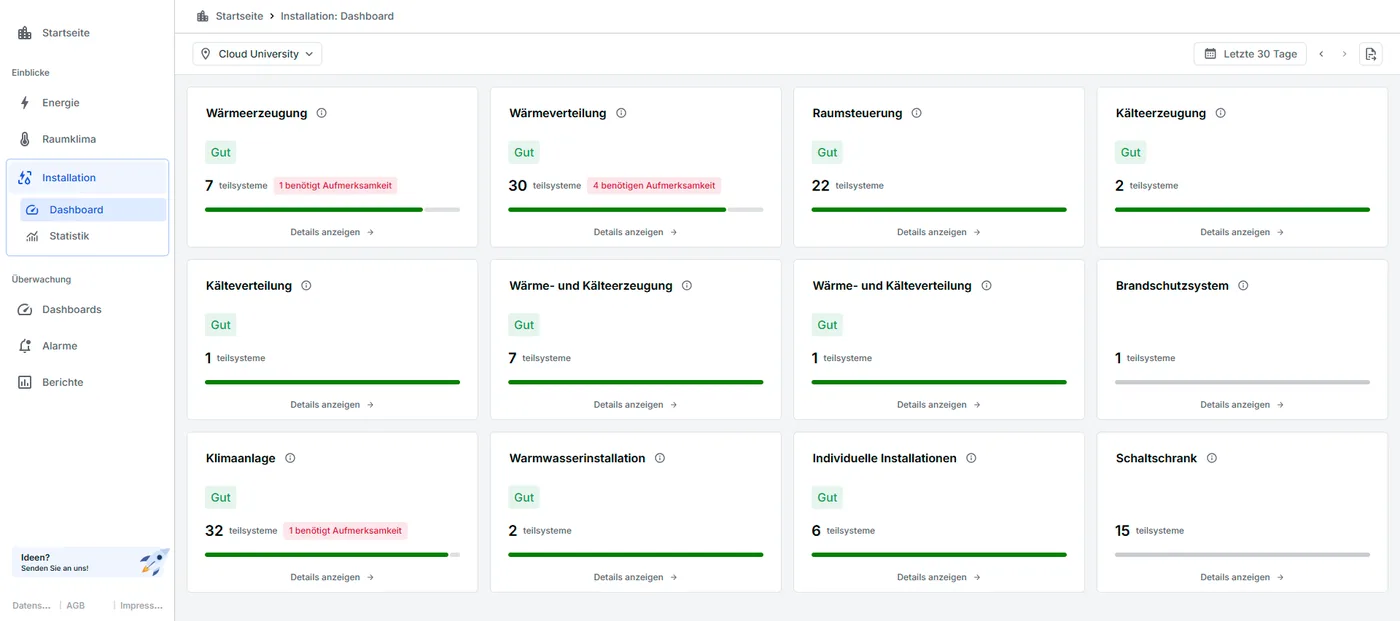
126 subsystems in 12 groups 6 need attention Demo building Cloud University · last 30 days
Room climate & control quality
Spot it early. Act early.
Scores for temperature, CO₂ and humidity make comfort measurable, over the day and across the week.
- Room climate scores and KPI rating
- Deviation analysis and control quality
- Regression and correlation analysis
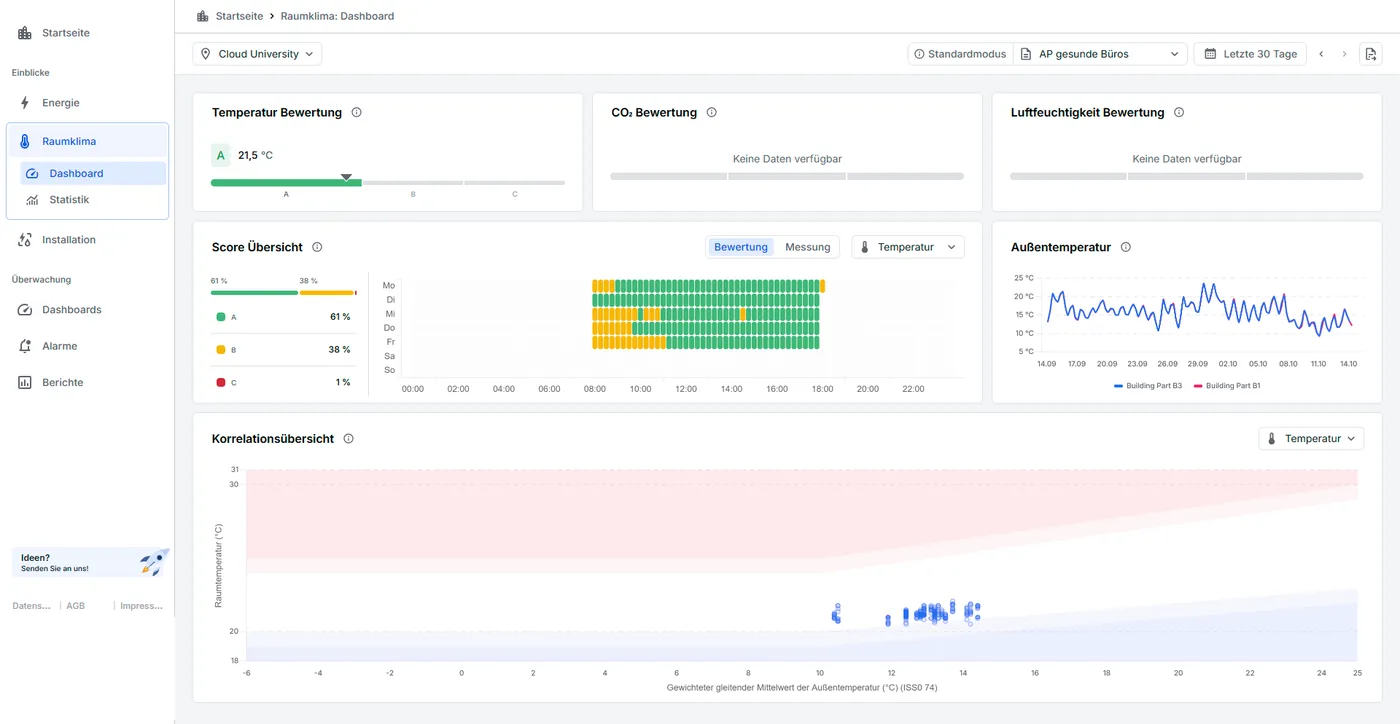
61 % class A according to the 2021 healthy offices standard (AP gesunde Büros) 21.5 °C on average Demo building Cloud University · last 30 days
Energy management
Understand energy. Identify potential.
Show generation, distribution and consumption clearly and analyse relationships.
- Energy flow and Sankey diagrams
- Benchmarking of systems and installations
- KPIs for quality rating and spot market
Asset management
Clarity for sound decisions.
Condense building information into individual dashboards and automated reports, from single site to portfolio.
- Individual dashboards for different roles
- Energy and management reports
- Site and portfolio overviews
brix2bytes benefits at a glance
Data in. Decisions out.
Transparency & performance
- System performance at a glance
- Setpoint deviations
- Energy flow and Sankey
Act early
- Room climate scores and KPIs
- Deviation analysis and control quality
- Regression and correlation
Energy management
- Benchmarking
- KPIs for quality rating
- Spot market
Customisation & reporting
- Dashboards for different roles
- Individual energy and management reports
- Site and portfolio overviews
Open & scalable platform
- APIs for further systems and edge devices
- Fewer manual evaluations
- Scales beyond individual buildings
AI & future services
- Foundation for operational intelligence
- Digital building twin
- Platform for new algorithms, apps and add-ons such as en:predict
Energy management
Find the energy guzzlers. At a glance.
The Sankey diagram shows where energy comes from and where it goes. Large consumers stand out immediately. This is exactly where optimisation and en:predict come in.
Example annual balance of an office building in MWh, schematic. Hover over a flow to see details.
en:predict powered by BrainBox AI
Your building now thinks ahead.
en:predict learns the thermal behaviour of your building, takes weather forecasts and occupancy into account and continuously adjusts heating, ventilation and air conditioning ahead of time. Autonomously, around the clock.
Conventional control en:predict Comfort band 20.5–22.5 °C during occupancy Peak load
Schematic illustration, not measured values. The actual effect depends on the building, its technical systems and its use.
Your protected zone · data sovereignty stays with you and Kieback&Peter
Building automation
Automation stations and systems, maintained by Kieback&Peter.
brix2bytes
Secure connection between system and cloud. No third party accesses your systems directly.
en:predict
The BrainBox AI engine calculates optimised setpoints and returns them via brix2bytes.
Third-party gateway: not needed. No additional hardware is installed in your system. The connection to en:predict runs exclusively via brix2bytes.
Measurable results
Results are assessed against the baseline, transparently in brix2bytes.
Predictive, not reactive
Control acts before deviations occur: less energy with the same or better comfort.
Available with every package
en:predict complements every brix2bytes package. We check the technical requirements together with you.
* Energy savings of up to 25 % for heating, ventilation and air conditioning are a manufacturer's figure from BrainBox AI. Actual savings depend on the building, its technical systems and its use and are assessed individually in each project.
Packages
Start small. Scale big.
From digital access without a connected building to a tailored solution. We will advise you on which package fits.
Start & self-service
Even without a connected building.
- Manage documents and contracts
- Discover services
Monitoring & transparency
Room climate and installation in view.
- Dashboards and status
- Reporting
Energy & optimisation
Everything in Standard, plus energy management.
- Energy management
- Energy analyses and KPIs
Tailored solution
Built around your requirements.
- Designed together with you
- Your own dashboards, interfaces, reports
en:predict powered by BrainBox AI
AI-based energy optimisation for the building, available with any package. We check the technical requirements for each product.
More about en:predict: Predictive control at a glance
Automation + IoT under one roof · since 1927
Others first have to get into the building. We are already there.
We do not look at IoT and artificial intelligence in isolation. Kieback&Peter connects the building automation we plan, build and maintain in more than 60,000 buildings with the IoT world. From a single source.
Dashboards · Reports · Apps · en:predictWhat operators, energy managers and the board see.
brix2bytesData, analyses, interfaces. The only connection to the outside.
Secure connection · APIs · Edge devicesEncrypted, without third-party gateways.
Automation stations · Systems · Meters · SensorsPlanned, built and maintained by Kieback&Peter.
Industries
Built for buildings that have to do more.
Retail & chains
Many sites, one view: comparable KPIs, central reports and AI optimisation across the entire branch network.
Healthcare & research
High demands on room climate and availability: detect deviations before they become critical.
Office & real estate portfolios
Transparency for owners and operators: energy, comfort and ESG KPIs per building and portfolio.
We built it. Now we scale it.
Get started.
Tell us about your building. We will show you which insights brix2bytes delivers and whether en:predict is suitable for your systems.
See more. Act sooner. Decide better.
Direct contact to the Digital Solution Sales Team:
We digitalise buildings for a better world. en:predict is a Kieback&Peter product powered by BrainBox AI. Savings figures are manufacturer's figures and not a guarantee; the effect depends on the individual building.